Introduction
Configure uptime monitors with New Relic to automatically open an incident in PagerDuty and notify whoever's on-call, following a set escalation path.
Welcome! This guide will help you configure uptime monitors on a Pantheon Site with New Relic® to automatically open an incident in PagerDuty and notify whoever's on-call, following a set escalation path.
In this guide, you’ll learn how to:
- Monitor site uptime and set alert conditions in New Relic®
- Create an on-call schedule and escalation policy for your team in PagerDuty
- Integrate New Relic® with PagerDuty to send notifications to whoever is on-call (SMS, email, phone call) when an incident occurs
- Integrate PagerDuty with Slack to acknowledge and resolve incidents (optional)
Before You Begin
To get started, you need to activate New Relic® Performance Monitoring on Pantheon:
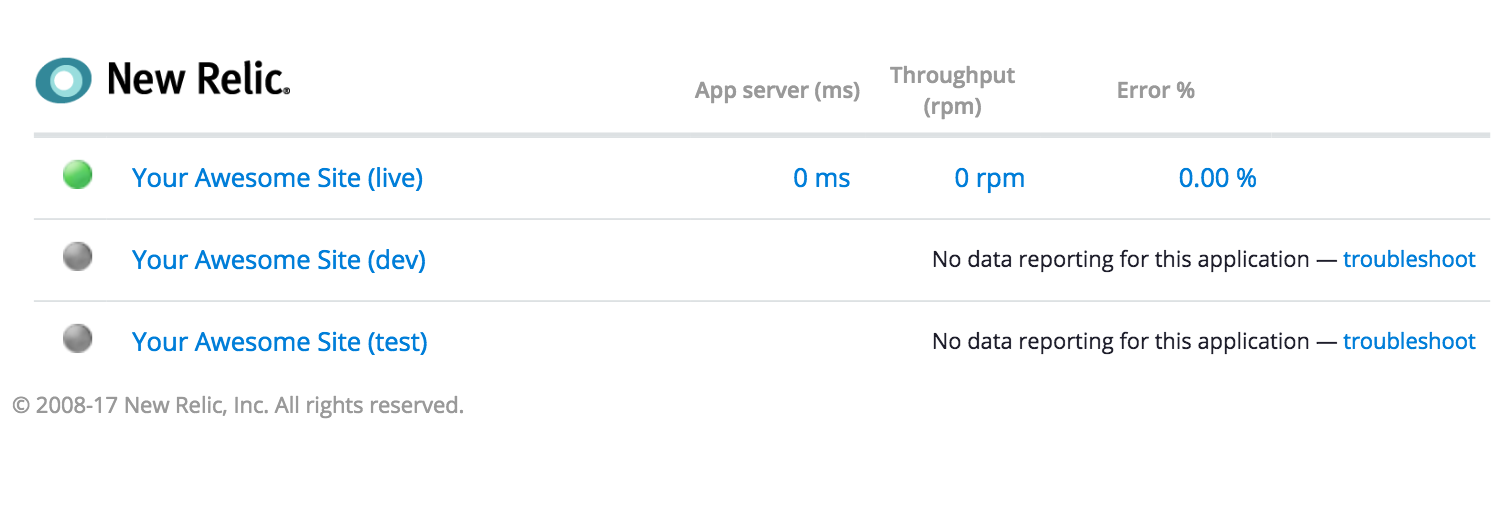
- Navigate to the Live environment in your Site Dashboard, and click New Relic.
- Click the Activate New Relic Pro button.
- Use the Visit Live Site and browse your site for a few minutes to generate data in New Relic®: