October 1, 2026
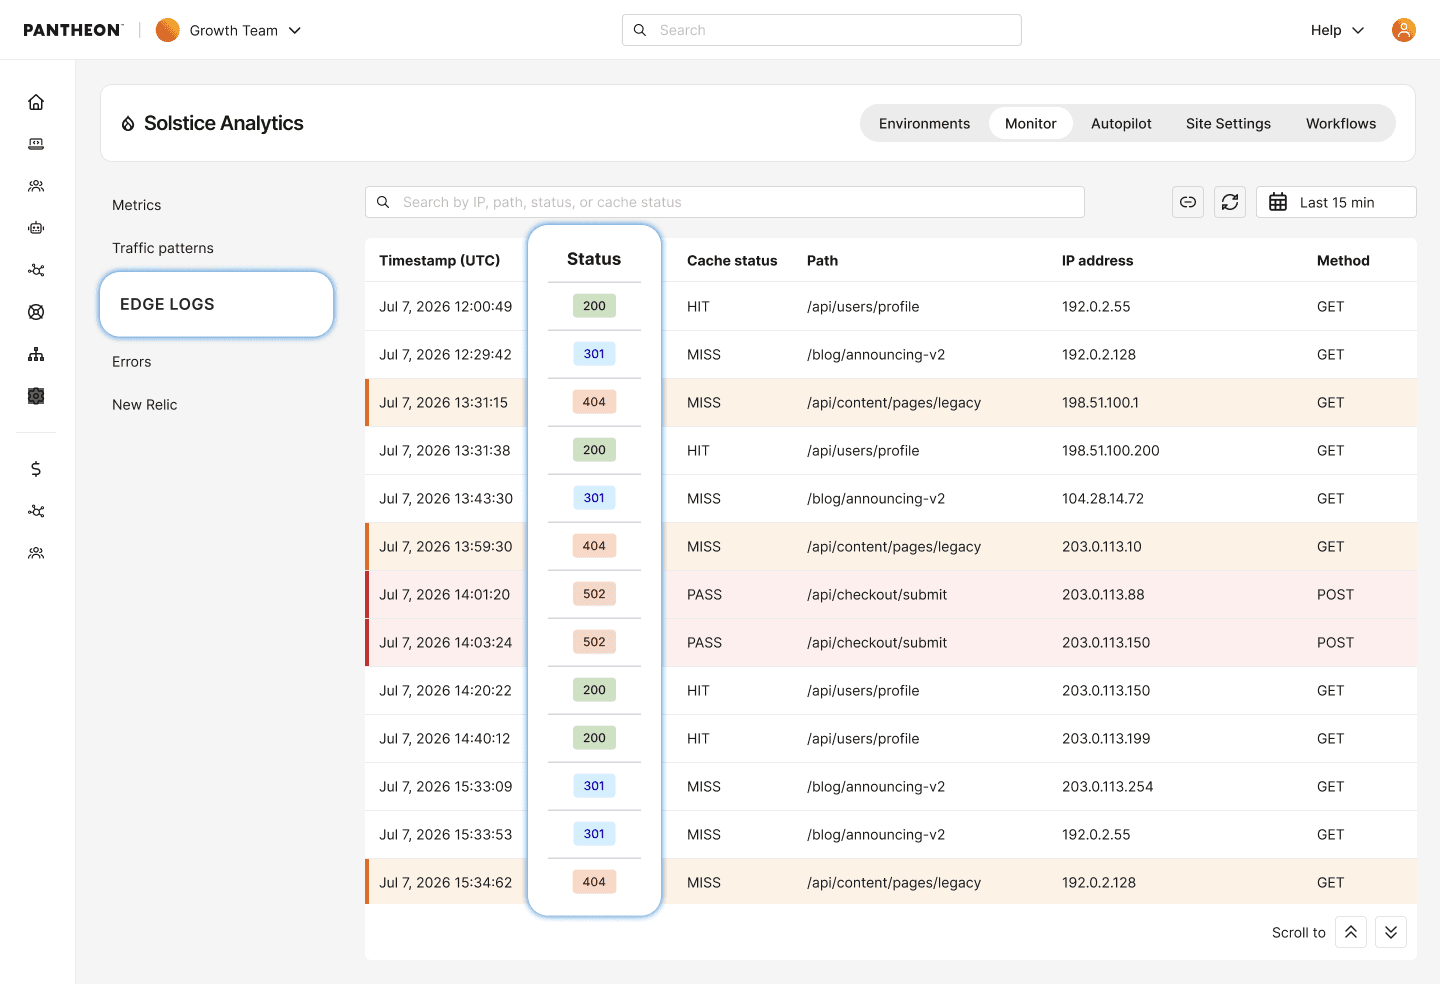
Pantheon now shows edge-level request activity in the dashboard, including cache statuses, ASNs, and response codes.
- A new log explorer in the site dashboard shows how requests were handled at the edge, allowing request-specific investigation for up to 24 hours.
- Search by HTTP status code, path, client IP, user agent, ASN, and time range.
- Copy a permalink to a specific log view, including your search and time range, to share with a teammate for review.
For details, see related documentation.
Information:
Note
This feature requires your site to be on our next-generation Global CDN. If your workspace includes sites still on our legacy Global CDN, your performance overview will only reflect migrated sites.
If you have not started or completed your migration, visit our documentation to get started.