Pantheon release notes

Your destination for staying informed about our latest innovations and product updates.
Subscribe to RSS feed
User interface
August 26, 2026

Pantheon's GitLab support for external repositories is now generally available to everyone directly from the Pantheon Dashboard, alongside GitHub and Pantheon-hosted Git.

What's new

  • Dashboard support — When creating a new site, choose GitLab as your code host right alongside GitHub and Pantheon's integrated Git repository — no Terminus required.
  • Self-hosted GitLab — Connect to GitLab.com or your own self-hosted GitLab instance.
  • Token-based authentication — Authenticate using a personal access token or group access token with api and write_repository scopes.

Where to find it

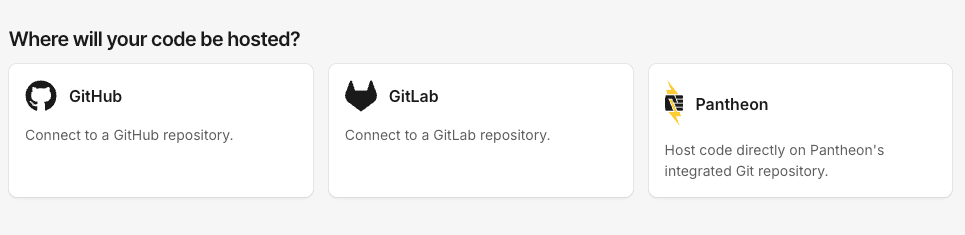
During site creation, select GitLab on the Where will your code be hosted? screen to connect your repository.

Where will your code be hosted screen showing GitHub, GitLab, and Pantheon options

For full setup instructions, see the related documentation.

August 24, 2026

Getting help on Pantheon is now faster and simpler. The Support tab in your dashboard will soon have a single access point for all support requests: start a conversation, describe your issue, and get routed based on your needs.

What's new

One place to get help. The previous ticket options in the dashboard have been replaced by a single, AI-powered conversational entry point on the Support tab. No more sifting through endless menus or categories to choose up front—just describe what you need.

Faster answers. Many common questions are now resolved immediately, any time of day, without waiting for a queued ticket response.

Routing based on your needs. When your request needs hands-on help, it's handed off to the right support team with the context you've already shared—prioritized and categorized automatically—so you don't repeat yourself, and your issue reaches the right people sooner.

Get the best experience: start from your workspace

Support access is tied to your workspace plan. For the fastest, most complete experience, open Support from the workspace you're working in rather than from an individual site. Starting from your workspace ensures you receive the full support benefits of your plan.

What you need to do

Nothing—there's no action required, and any current open tickets are unaffected. Next time you need help, head to the Support tab in your workspace and simply start a conversation with our AI-powered assistant.

Note: You can reach our support team at any time—just ask, and we’ll get you to the right person. Phone support remains available for eligible plans.

Built with your privacy in mind

Support conversations are processed solely to help resolve your request. Your data is not used to train AI models, and our AI providers do not retain or use your data for their own purposes. Support interactions remain subject to Pantheon's existing Privacy Policy and data protection commitments.

August 17, 2026

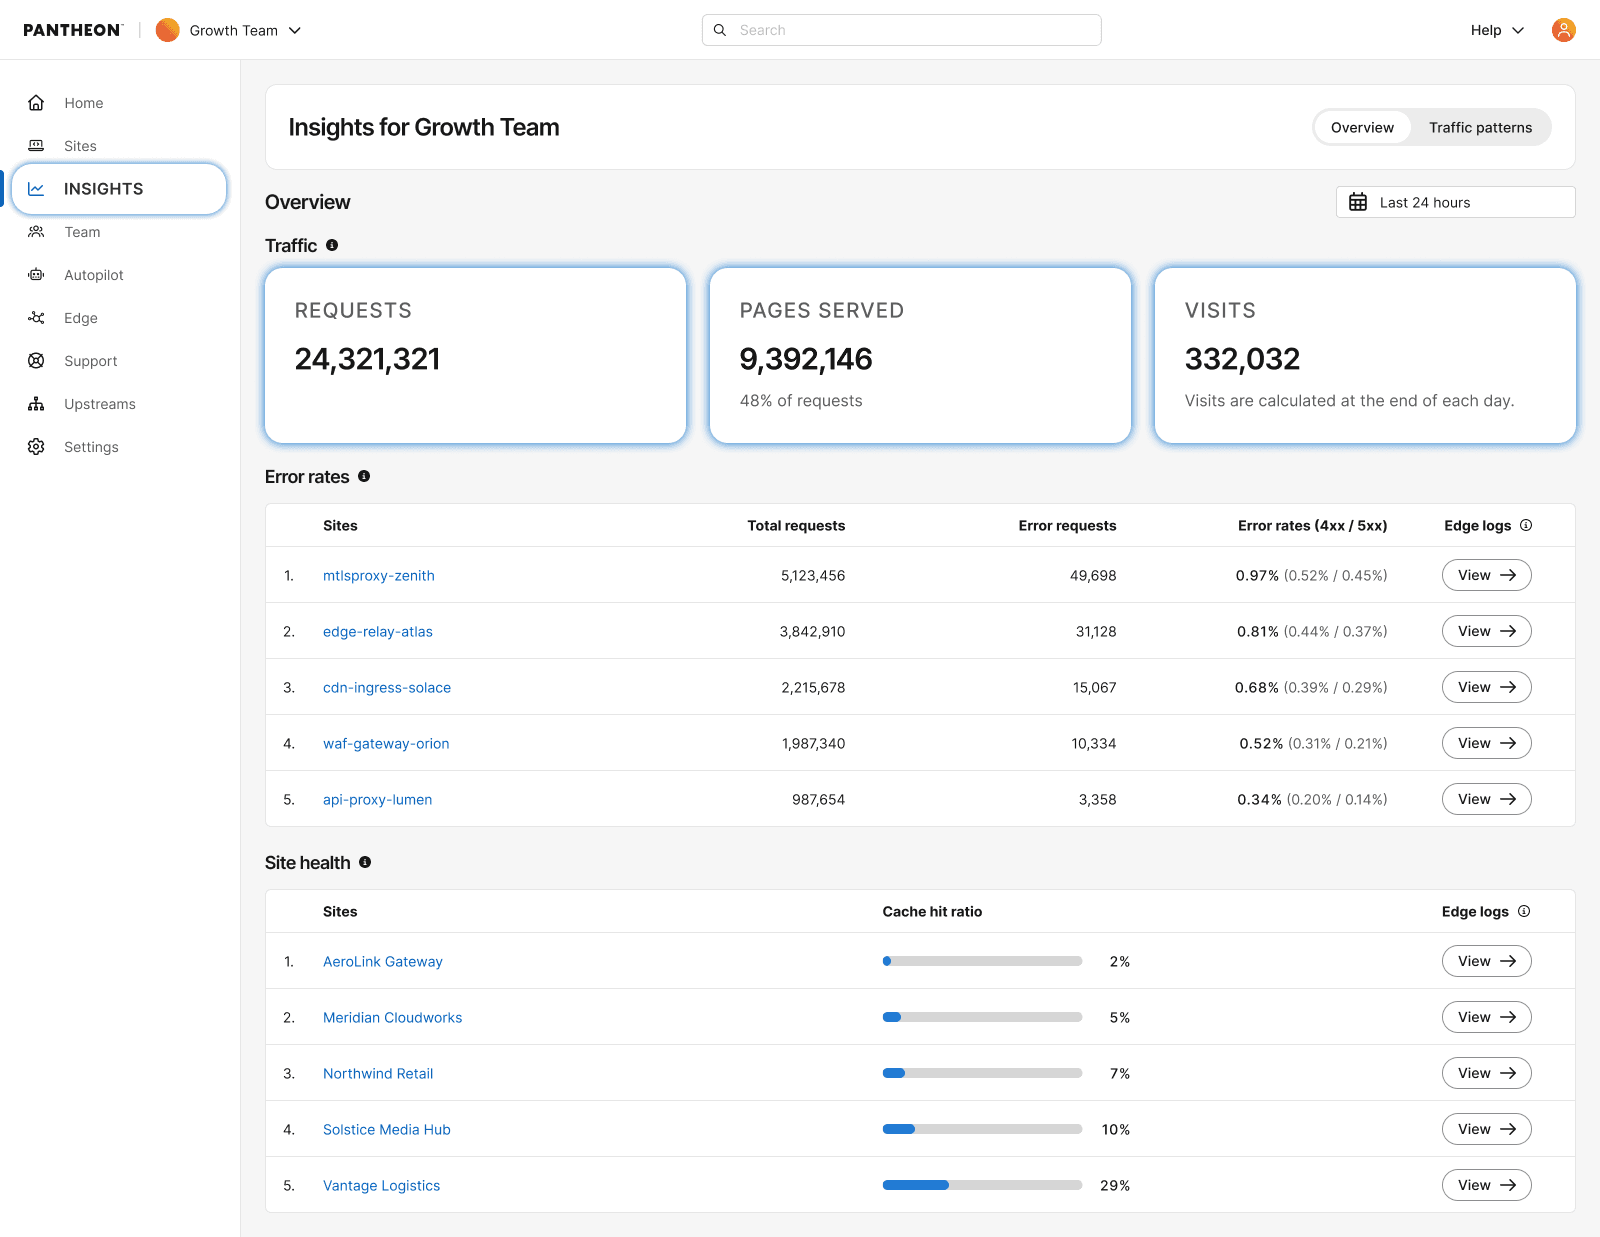
Pantheon has extended traffic visibility on the dashboard – you can now see aggregated traffic insights across your entire workspace, giving portfolio managers and agencies a single view of what's happening across all their sites.

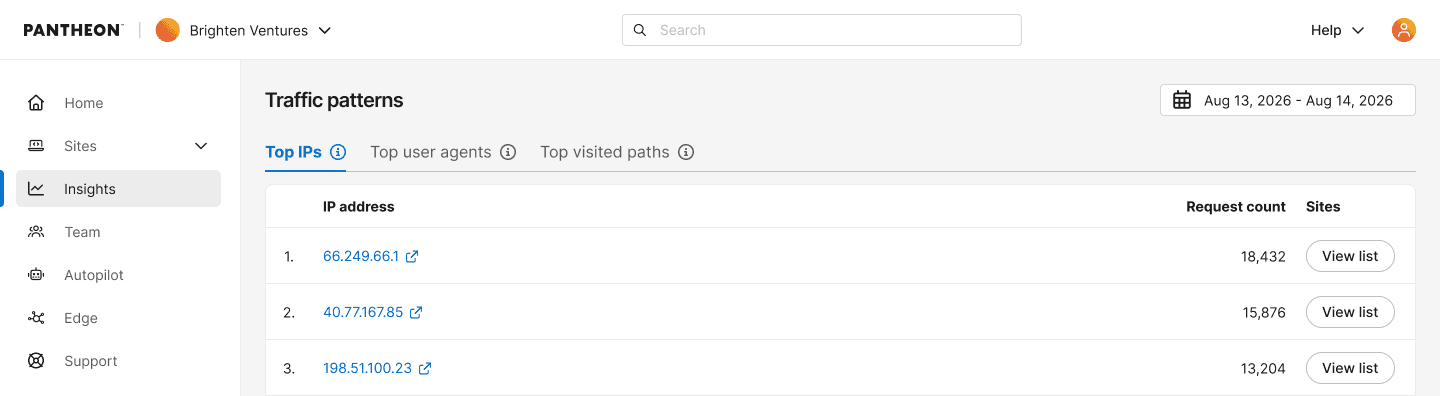
  • Workspace Top IPs, User Agents, and Visited Paths: New tabs on the workspace Insights page show the top IP addresses, user agents, and visited paths generating traffic across every site in your workspace – no need to check each site individually to spot patterns.
  • Drill-Down by Site: Click into any row to see which specific sites are driving that traffic, so you can quickly pinpoint where to focus your attention.
  • User Agent Parsing: Instantly see a parsed breakdown of any user agent to help you confirm whether high-volume traffic is a real visitor or something worth investigating further.
  • IP Investigation: Click any IP address to open its AbuseIPDB report so you can quickly assess whether it has a history of malicious activity.

For more details, see related documentation.

Information:
Note

This feature is only available for sites that have migrated to our next-generation Global CDN. If your workspace includes sites still on our legacy Global CDN, your insights data will only reflect the migrated sites.

If you have not started or completed your migration, visit our documentation to get started.

top IPs

August 17, 2026

What's new

You can now choose how the Pantheon Dashboard looks. Alongside the classic Light appearance, the Dashboard supports a full Dark mode, plus a System option that automatically follows your device or browser's own light/dark setting.

Pick your preference from the Theme control in your User Menu:

  • Light — the classic Dashboard appearance (default)
  • Dark — a full dark color scheme across the Dashboard
  • System — automatically matches your OS or browser's current preference, and updates live if that setting changes

Your choice is saved to your account, so it follows you across devices and browsers — no need to set it again each time you log in somewhere new. If you haven't set a preference, the Dashboard defaults to Light.

Why it matters

Dark mode reduces eye strain in low-light environments, can save battery on some devices, and matches how many people prefer to work. If that preference is already set at the OS level, System mode picks it up automatically — no extra effort required.

Where to find it

Look for the Theme option in your User Menu at the top of the Dashboard. For more details, see related documentation.

August 7, 2026

You can now update the credentials for a Custom Upstream directly from the Pantheon Dashboard — no support ticket or new upstream required. Previously, changing a private repository's access token meant either creating a new Custom Upstream and switching each site over to it, or contacting Pantheon Support.

What's new

  • The upstream Settings page now has a Repository credentials section that shows whether credentials are set and lets you update them — a GitHub personal access token or a Bitbucket repository access token.
  • The stored credential is masked and never displayed back in the Dashboard.

Changing the repository URL still requires creating a new Custom Upstream.

For steps, see Edit an Existing Custom Upstream.

July 23, 2026

We are continuing to enhance the Top Traffic Patterns interface with clearer visibility into what traffic actually counts toward your bill.

You can now filter the Top Traffic Sources tables – Top Paths, Top IPs, and Top User Agents – to show only Pages Served, the subset of requests that count toward billing. This makes it easy to separate the noise of total traffic from the actual billable traffic driving your usage. A new Total Requests breakdown also shows the split between Pages Served and uncounted requests at a glance.

Note: This feature is currently available only for sites migrated to Pantheon's new Global CDN (GCDN). If you don't yet see the toggle on your dashboard, consider migrating to the new GCDN to unlock this and other upcoming traffic insight enhancements.

traffic patterns interface showing new filter for pages served

July 14, 2026

A visual refresh of the Pantheon Dashboard is rolling out gradually over the next 2–4 weeks, reflecting an update to Pantheon's underlying design system. You may notice colors, typography, and some components looking slightly different day to day as the rollout progresses — this is expected.

Why we're doing this

This refresh modernizes the look of the Dashboard and brings it in line with Pantheon's updated design system. It also sets us up to build and ship new Dashboard features more quickly going forward.

What's staying the same

The layout, navigation, and workflows you're used to are not changing. This is a visual update only — nothing is moving, and no functionality is changing.

Rollout timeline

This update is being released gradually rather than all at once. Because of that, you may see some parts of the Dashboard update before others, and the look may continue to shift slightly as the rollout completes.

No action required

This change applies automatically. There's nothing you need to do to prepare for or opt into this update.

June 1, 2026

We're introducing a User Agent Parser to the site metrics traffic tables to make traffic analysis faster and more intuitive.

Clicking View details next to any user agent now opens a modal that cleanly translates the raw string into readable components, including:

  • Browser (Name & Version)
  • Operating System (Name & Version)
  • Device (Model, Type, & Vendor)
  • CPU Architecture
  • Rendering Engine

This update allows you to quickly identify specific traffic sources, browsers, and devices at a glance, while still preserving the exact raw string for your records and security rules.

User Agent Parser modal showing parsed browser, OS, device, CPU, and engine details