New Relic Ping Monitors
Page two of our guide on Pagerduty integration with New Relic for incident management.
In this lesson, we'll set up a new ping monitor to periodically check the site's availability in New Relic® Synthetics.
Please contact support if you encounter a permissions warning in New Relic while following the steps below.
Create a Monitor
-
Navigate to the Live environment in your Site Dashboard, and click New Relic then Go to New Relic.
-
Select Synthetics from the menu bar at the top of the page.
-
Select Get started, then under Back-end, front-end, and mobile applications, select New Relic Synthetics:
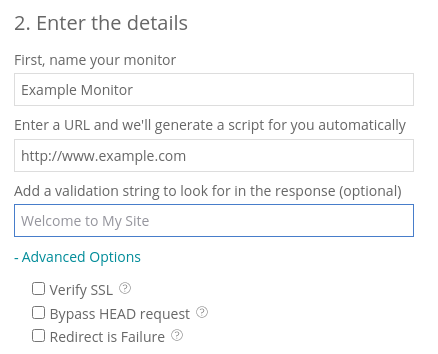
- Enter the details for the URL you want to monitor (e.g.
https://www.example.com).
-
Click Advanced Options and check Verify SSL.
-
Select the locations you wish to check the site from. We recommend picking locations that correspond to your site's visitors to reduce the risk of false-positives due to long-distance networking issues.
-
Set the frequency for checks. We suggest 5 minutes.
-
Click Create my monitor.
-
We'll setup notifications in a later lesson with PagerDuty.
Pantheon can provide New Relic® ping monitoring for free as part of the service. However, more advanced monitoring — full browser testing, or scripted interactions — is only available to customers on an annual contract and requires an additional cost. Contact our sales team or your dedicated account manager for details.
Configure Alert Policy
Now that you have a monitor setup in New Relic® to periodically check your Pantheon site, you'll need to configure alerts for downtime incidents:
-
Navigate to the Live environment in your Site Dashboard, and click New Relic then Go to New Relic.
-
Select Alerts & AI from the menu bar at the top of the page, then Policies from the menu on the right.
-
Select Create a policy
-
Enter a name for this alert policy, such as the site name (e.g.,
example.com) and an incident preference (We suggest By policy), then click Create alert policy. -
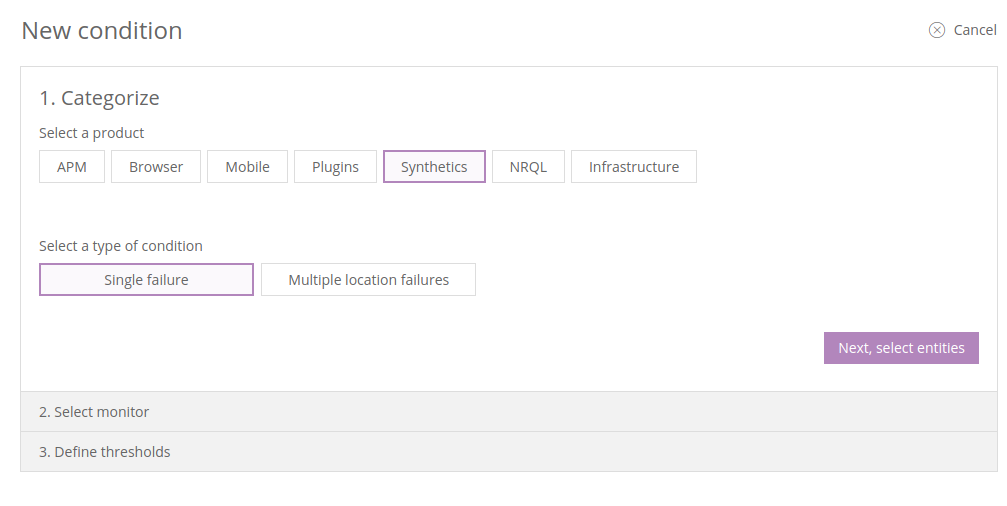
Select Create a condition, and choose Synthetics and either single failure or multiple location failures, then Next, select entities:
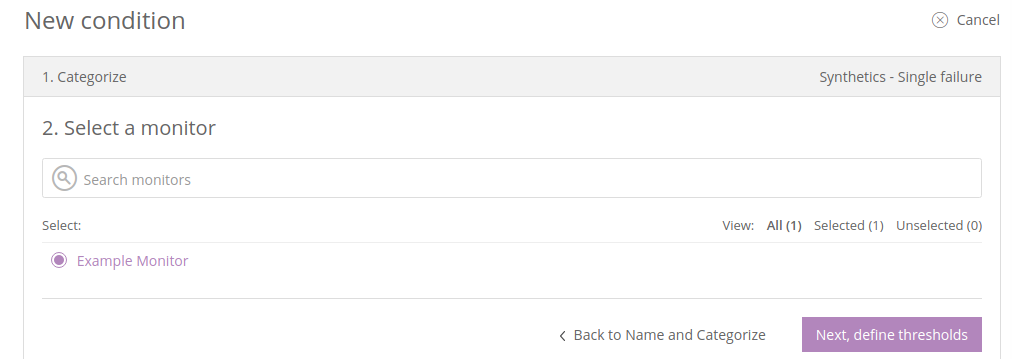
- Select the monitor that you created in the previous step and Next, define thresholds.
- If you selected multiple location failures, define the number of locations to trigger the failure. Name the Click Create condition.
False Alarms
Availability monitoring services (for example, Pingdom and New Relic® Synthetics) function by periodically reaching out to sites to gauge availability. Some failures in availability do not require action and can be considered false alarms, such as failures due to internet routing or idle containers.
Internet Routing
A temporary routing issue between a particular monitoring service endpoint and one of our CDN CHI metro Points of Presence (POPs) can result in an alert. The internet is a big place, and there's a lot of potential for intermittent packet loss between any two points, depending on the route taken. A single loss of access from one point to another does not always correlate to an issue with the site itself.
Tools like MTR can help to diagnose a routing issue.
Idle Containers
Containers on Pantheon are automatically spun down following a period of inactivity, then spun back up once a web request is made. Monitoring pings sent between the initial request and the completed spin-up may fail, but do not necessarily indicate an issue. For details, review All About Application Containers.
Support for Handling Alerts
Before opening a support ticket based on an alert, take the following actions:
-
Refer to the alert message to confirm the event reported (what monitor it came from, what triggered it, etc.).
-
Determine whether the event was a false alarm.
-
Contact support after you have verified an outstanding alert and provide the following information:
-
Steps to reproduce the issue (including URLs or paths to files)
-
Environments affected (Multidev/Dev/Test/Live), if applicable
-
When the issue began
-
Error messages received
-
Links to screenshots or screencasts of the behavior, if necessary
-
If the issue creating the alert stems from the Pantheon Platform, we will investigate and resolve it. Alerts triggered by the site's code are not within Pantheon's scope of support. For details, refer to Getting Support.


