New Relic Performance Monitoring on Pantheon
Activate New Relic
Learn how to enable and use New Relic Performance Monitoring metrics and reports for your Drupal or WordPress site on Pantheon.
This section provides steps on how to activate and configure your New Relic® account.
Activate New Relic® Performance Monitoring
New Relic® is automatically enabled for all application containers added to the site, including Multidev environments. You can activate New Relic® in the Site Dashboard if you or a team member previously disabled it.
- Select the New Relic tab on your Site Dashboard, and then click Activate New Relic Pro:
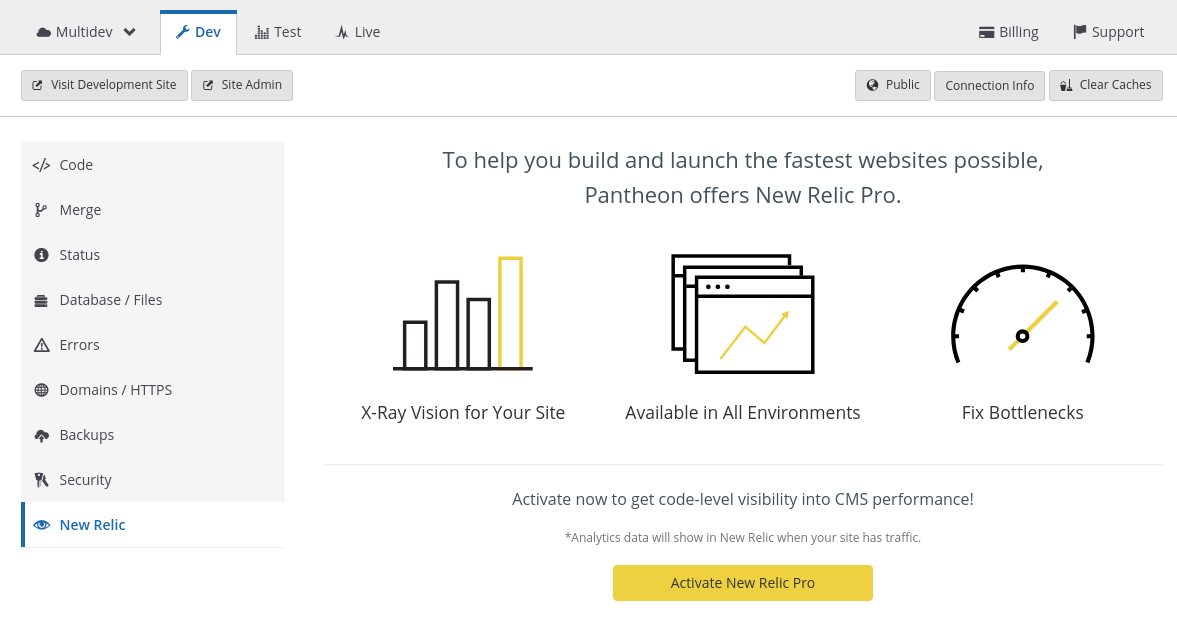
It may take several moments for the activation to complete.
- Visit your site in the browser and make some un-cached requests to generate data in New Relic®. It will take a few minutes for your information to become available in New Relic.
Configure New Relic® Performance Monitoring Access
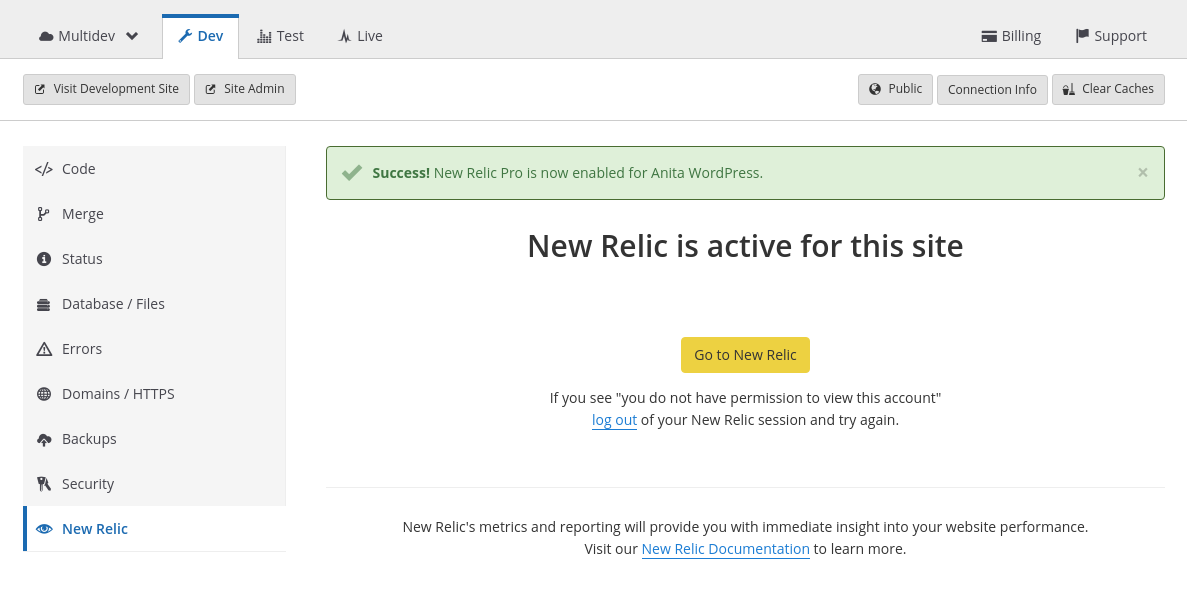
- Go to the New Relic tab on your Site Dashboard, and click Go to New Relic.
- Select your site from the center column, or access it via APM & services in the menu on the far left.
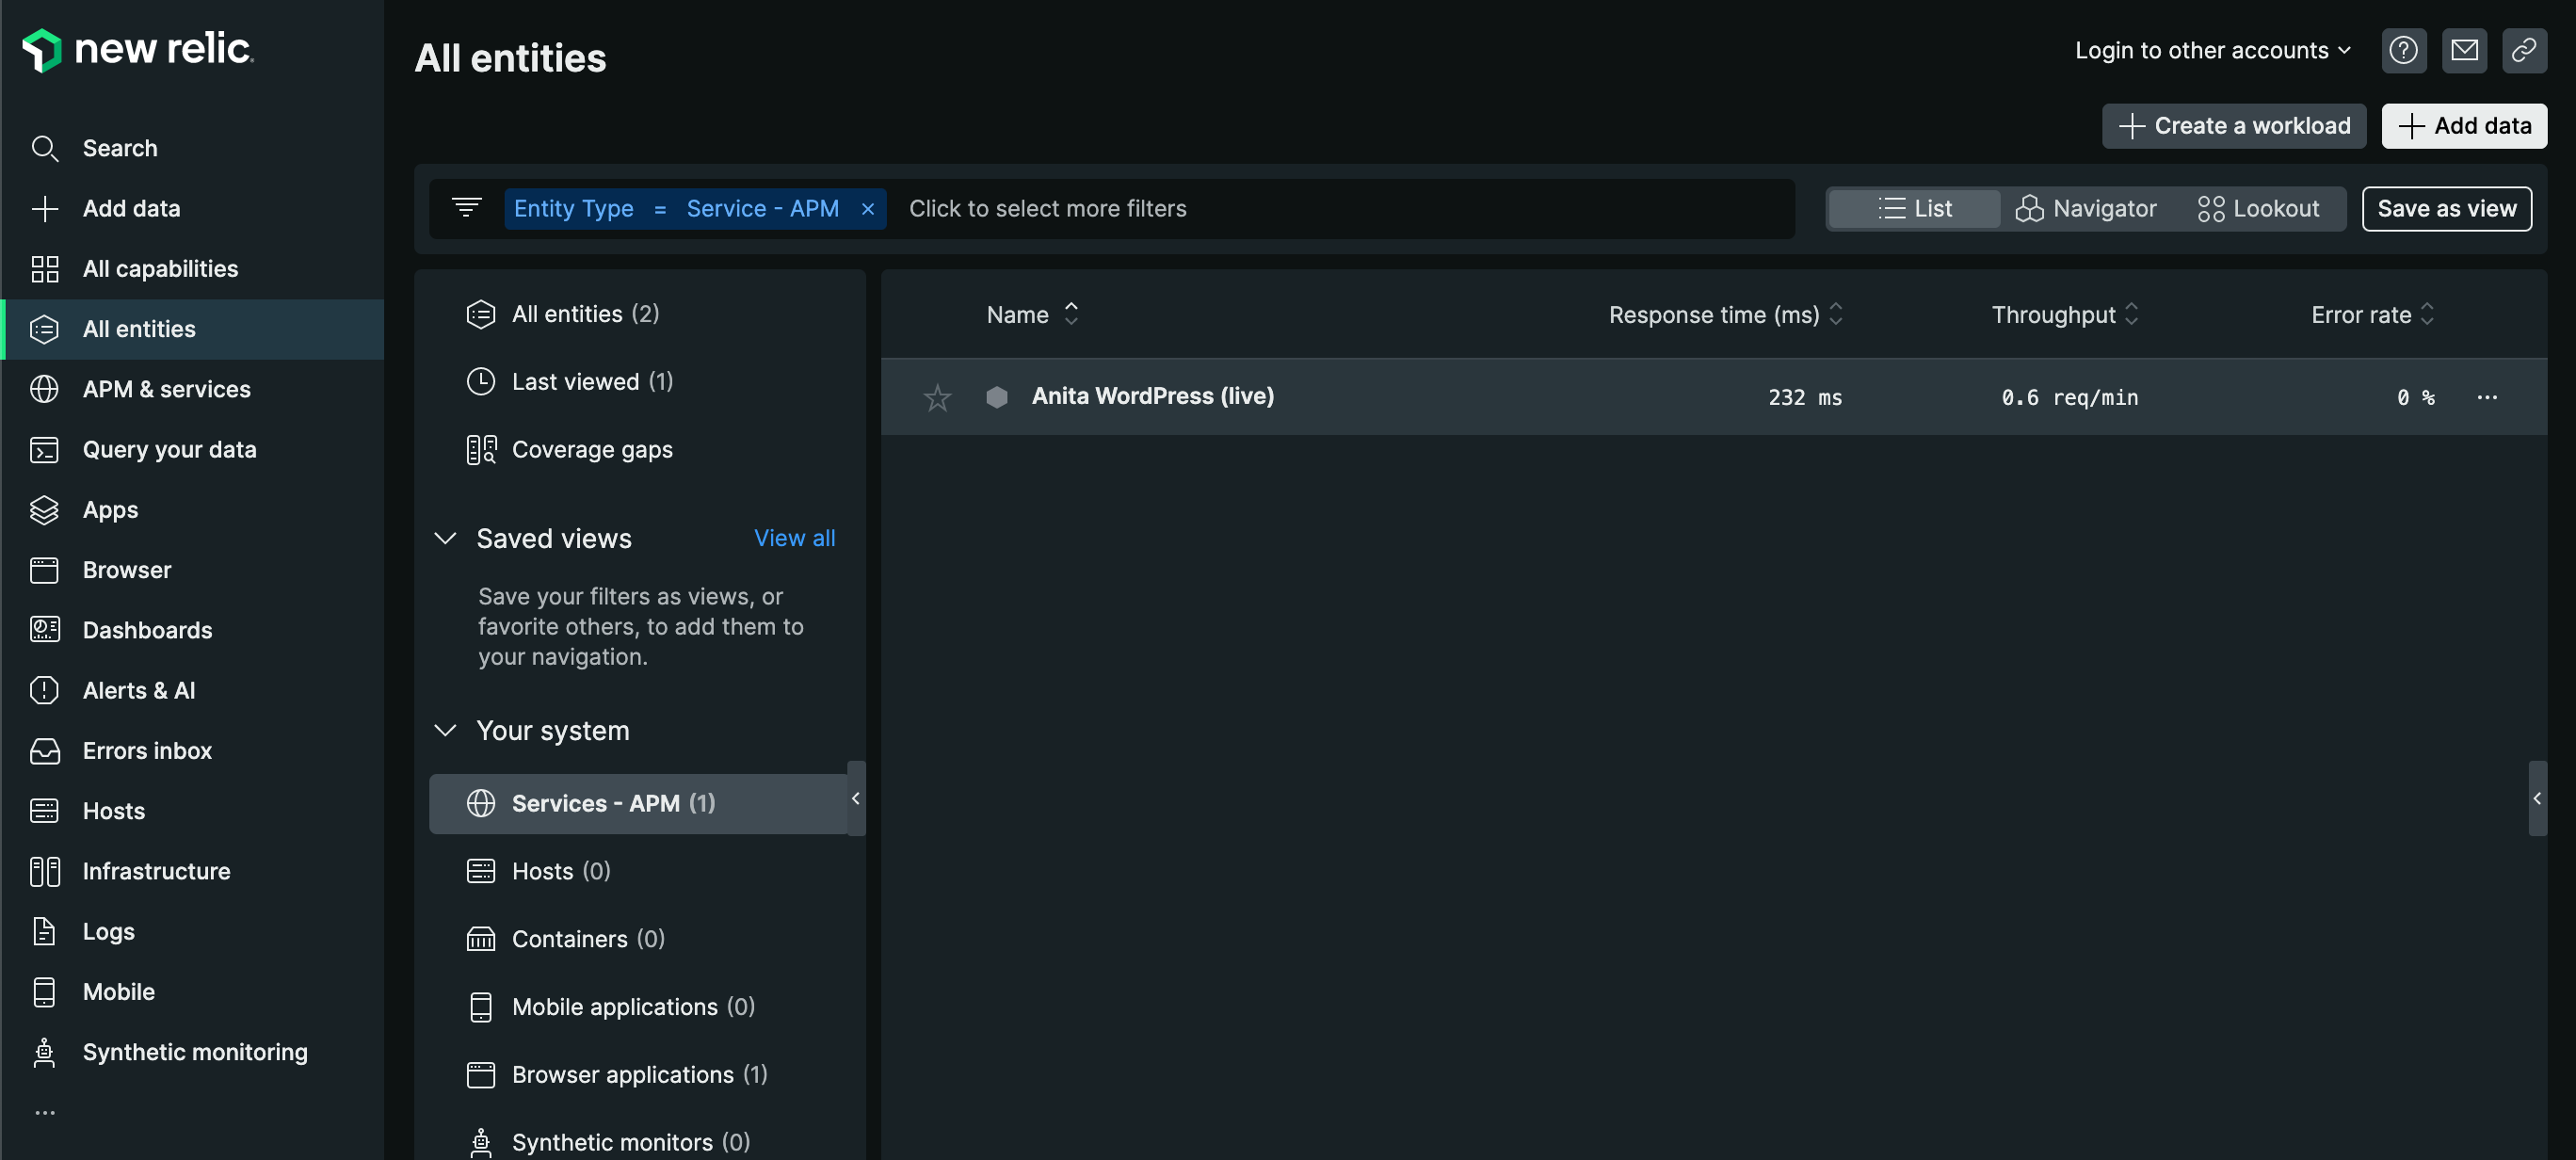
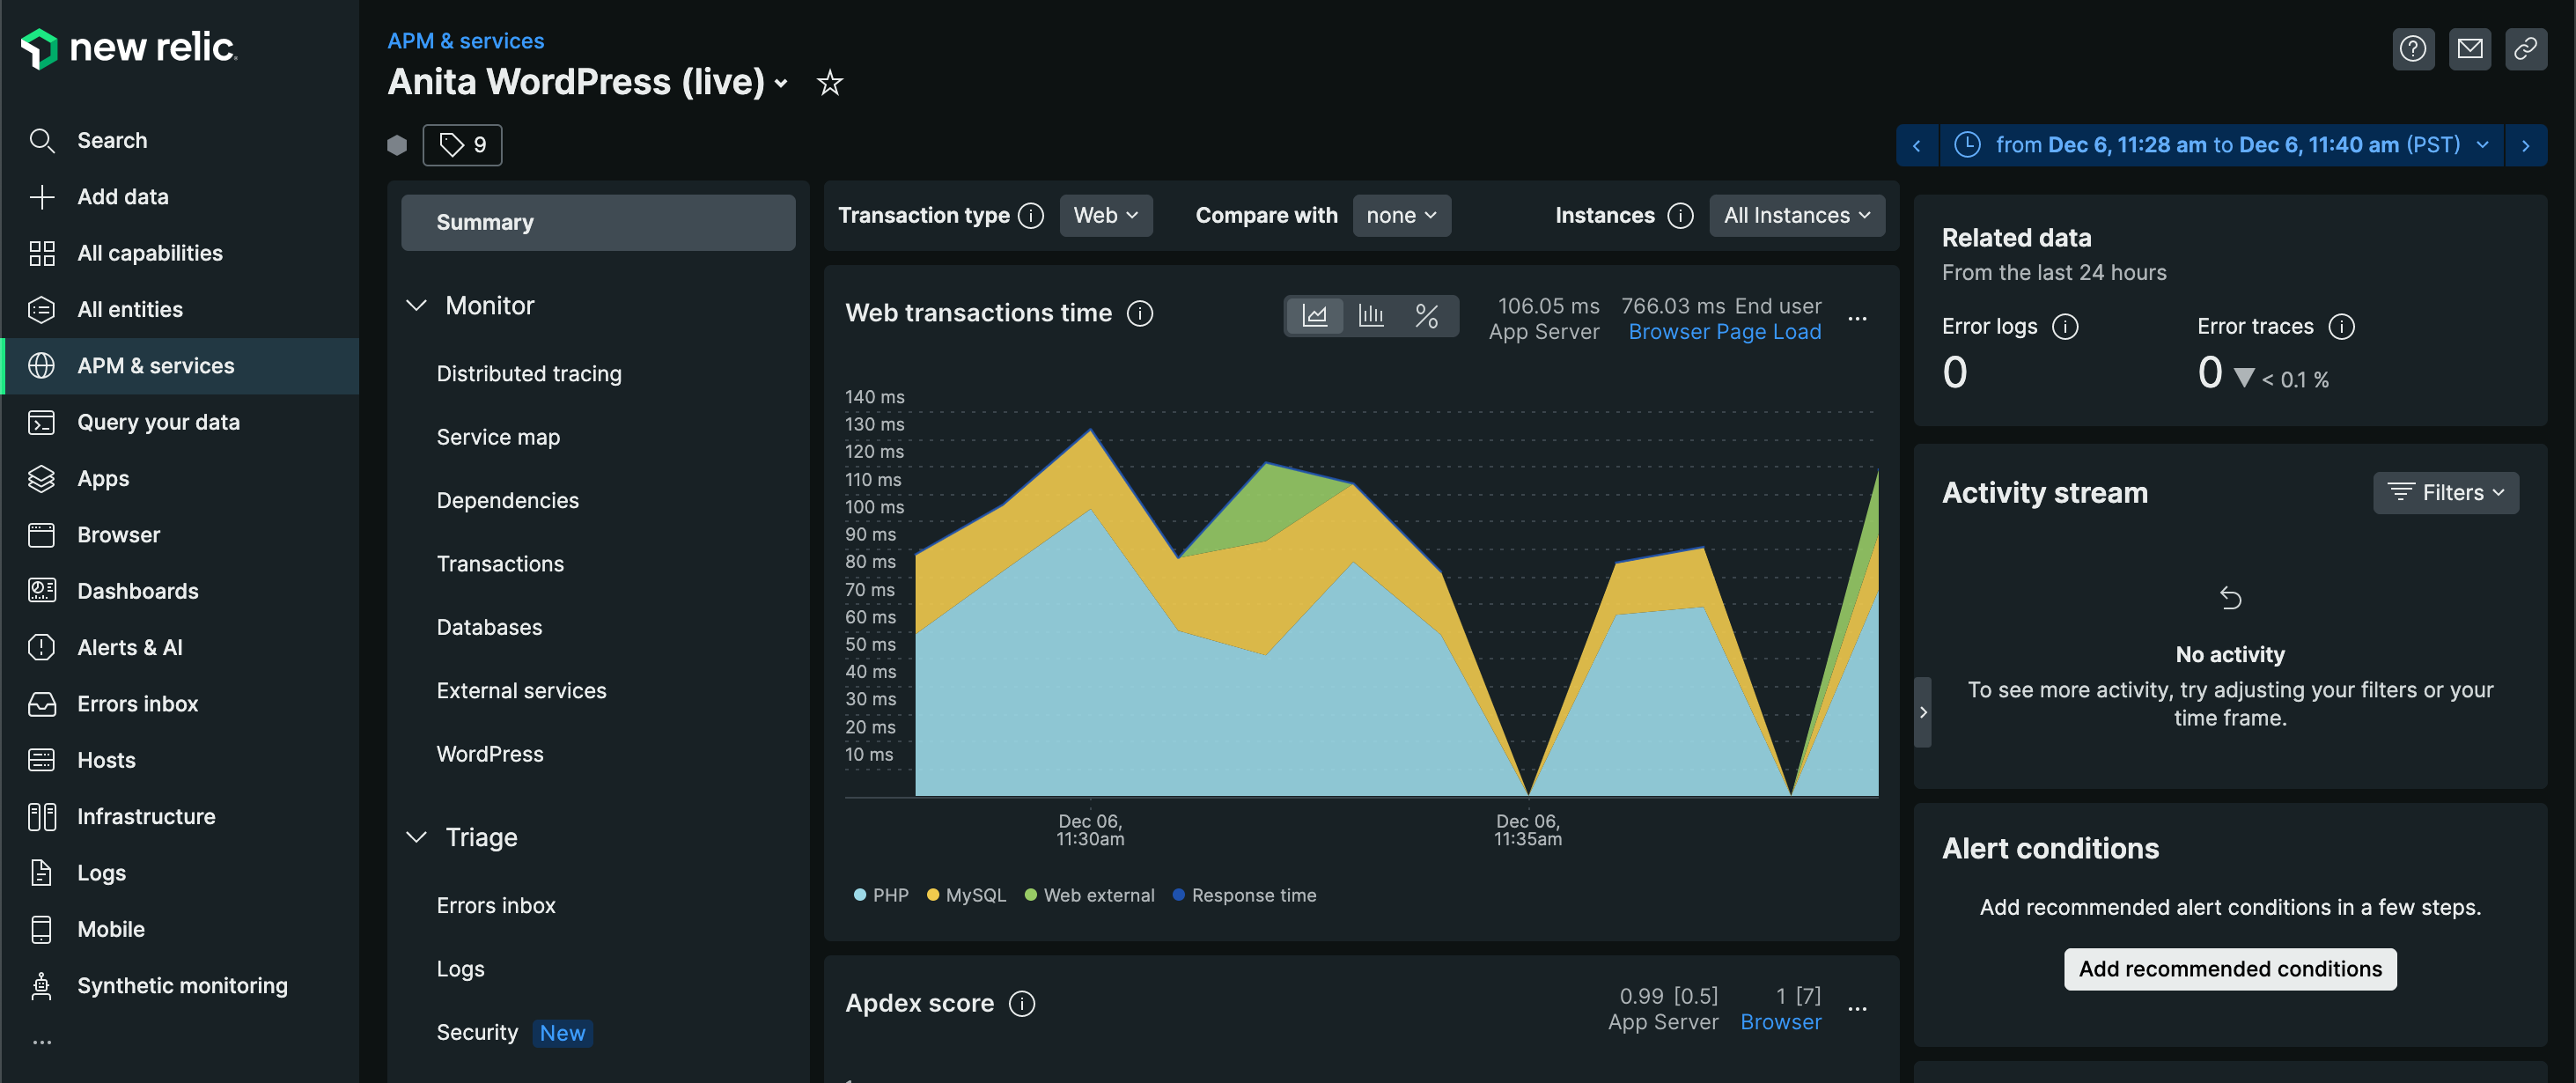
- Click your site name to access the data for your site.
Who is the New Relic® account associated with?
-
If the site owner is a user, the site owner's name and email address are used to create the New Relic® account.
-
If the site owner is an organization, the name and email address of the organization's Pantheon user who activates New Relic® is used to create the New Relic® account.
In both cases, there is not a one-to-one mapping between Pantheon users and New Relic® users. Every Pantheon user who selects Go to New Relic from the Pantheon dashboard is logged in as the same New Relic® user.
Open New Relic® Performance Monitoring
Moving forward, to open New Relic® Performance Monitoring:
-
Go to the Site Dashboard of the site you suspect is having problems with MySQL query performance.
-
Select the environment: Dev, Test, or Live.
-
Click the New Relic tab, and then select Go to New Relic.