Load Testing Drupal and WordPress with BlazeMeter
Learn how to use BlazeMeter to load test your Pantheon Drupal or WordPress site.
Load testing can expose slow page loads, heavy transactions, PHP errors, and database errors. BlazeMeter is one resource you can use to run load tests. This guide will explain how to do load test, and provide information on recognizing and resolving errors you may experience.
Load testing should be run prior to launch on Pantheon, and should not be run against Live environments that serve live traffic.
The Importance of Identifying Performance Hits
The days of simple static HTML sites are fading, and for Drupal and WordPress sites any page load can quickly become frustrating. Slow database queries, poorly configured (or nonexistent) caching, asset-heavy front end layers, long running transactions: individually these performance hits may only add a few hundred milliseconds on to the end user experience, but in aggregate they can weigh down performance or cause timeouts. Running a load test will help you identify potential pain points and causes of performance issues.
Important note about Drupal: While we recommend keeping Drupal’s Watchdog enabled to log important events, if your site is throwing errors, the database for your application will quickly grow and eventually stretch its limits. At the extreme end, this can slow down the application and even cause the site to timeout and crash. Even a single error or warning logged will slow down performance, so be sure to regularly review the DBlog and fix any errors. For more information on how to identify these errors, see Log Files on Pantheon.
Strategy and Planning
Traffic generated by your load testing counts as regular site traffic. Refer to Traffic Limits and Overages for more information. Publishing the results of your load and performance testing is against Pantheon's Acceptable Use Policy.
In order to configure your load test, you’ll need to calculate concurrent users, which are the number of users on the site at the same time. There are a couple of approaches depending on the metrics:
Convert visits per hour to concurrent users
concurrent_users = (hourly_visits * time_on_site) / 3600
Example: If you have 1,000 visits per hour, and each visitor stays on the average 3 minutes (180 seconds) on your site, that means you would have (1000 * 180) / 3600 = 50 concurrent users.
Convert visits per month to concurrent users
concurrent_users = (monthly_visits * time_on_site) / (3600 * 24 * 30)
Current vs. Estimated Metrics
If the site is live elsewhere and you have current traffic metrics, great! If not, you can estimate traffic numbers and patterns once the site goes live. Your best bet is to run the load test with more concurrent users than you expect. If you have historical data, use your previous high water mark for traffic when testing to ensure your site can handle peak load.
Aside from concurrent users, you’ll want to map out user behavior and time spent on the site.
Your First Load Test
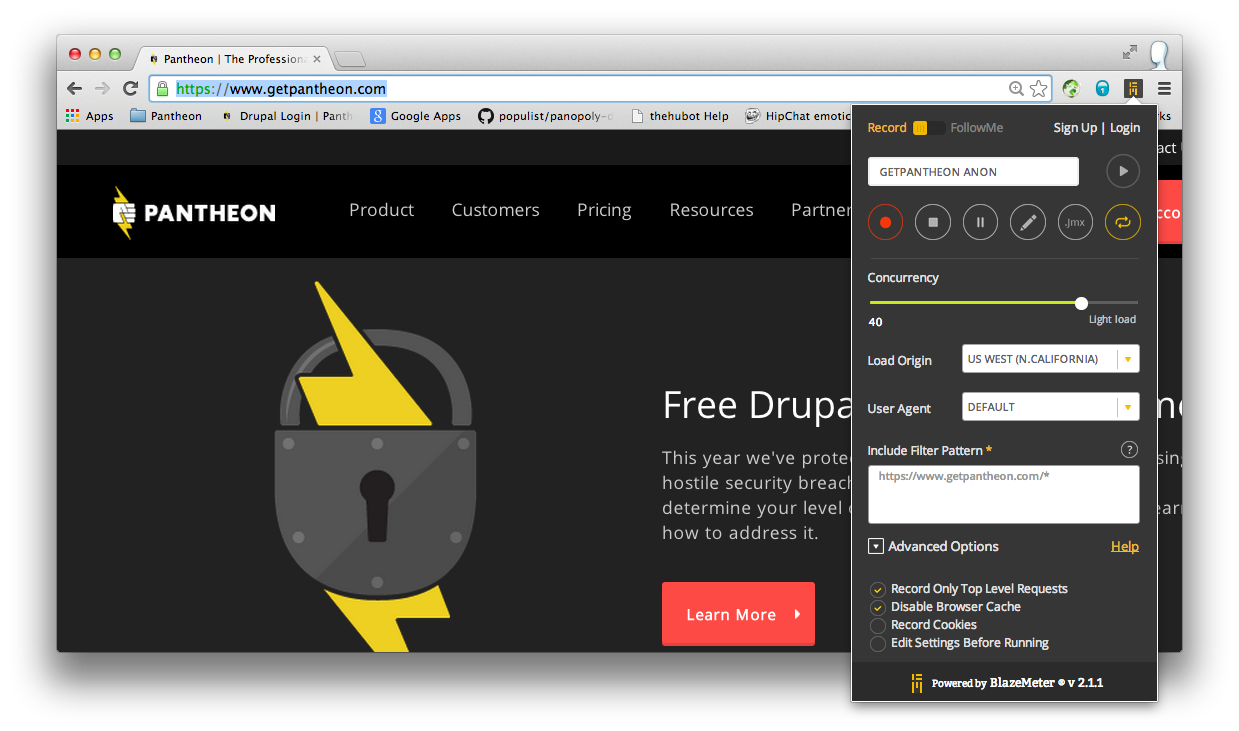
First, install the Chrome plugin on your Chrome browser and register for a free account with Blazemeter. Next, navigate to the site you'd like to test and click the BlazeMeter icon to open settings and begin recording. You'll have several configuration options:
- Record/Follow Me: Select Record
- Name of the test: Name your test configuration in a brief, client-specific way
- Concurrency: The number you calculated for concurrent users
- Load Origin: Dependent on project and traffic as outlined by client
- User Agent: Default
- Filter Pattern: The default filter pattern will be set to include
http://*/*andhttps://*/*You'll want to designate the top level domain. Example:https://livesitename.pantheonsite.io/and add an asterisk at the end so it looks likehttps://livesitename.pantheonsite.io/*so that all pages on the top level domain are captured. - Advanced Options: Select Record only Top Level Requests and Disable Browser Cache
Here is an example of what these settings would look like if we were to test our own site:
Integrate New Relic Pro
You can copy and paste your New Relic Pro data sharing API key into the New Relic section within BlazeMeter to analyze your application performance. To accomplish this, grab your API key from within your New Relic Pro account (Account Settings >> Integrations >> Data Sharing >> API Access) and paste it within the Add Test or Edit Test pages. Now you'll be able to see exactly how your resources are being used during every test from the dashboard. You can even access this data after a test has been completed, allowing you to compare results and track usage.
Recording a Test
-
Click the red record button in the plugin window.
-
Navigate through the user scenario > Click the BlazeMeter icon > Click Stop.
-
Select Edit recording to review the script.
-
Select Export to Jmeter, designated as the file extension
.jmx.This will begin an automatic download of the
.jmxfile. -
Rename the
.jmxfile before executing the test.
Note: If you are testing authenticated users, download JMeter to your local machine, and upload the .jmx file generated with the BlazeMeter plugin.
Executing a Test
-
Log in to your BlazeMeter account.
-
Select Add JMeter Test > Upload the renamed
.jmxfile. -
Set the following options for load scenario properties and save when finished:
- Location
- Virtual traffic origin, dependent on client provided metrics.
- Ramp Up
- How quickly the test will activate users, shown in seconds. You can keep the preset (300s) as is.
- Iterations
- This is set to infinity by default and will allow the user behavior to loop and finish out the test.
- Duration
- 15 to 30 minutes.
- Click the Tests icon > Select a test to run > Click Start Test (play icon).
Review and Share the Results
Results are graphed, along with any error messages, response times, and so forth. All tests are shared in "Sessions".
Follow the steps below to share public links with the client in the load test report.
-
Click the Share button.
-
Turn on sharing.
-
Copy the link.
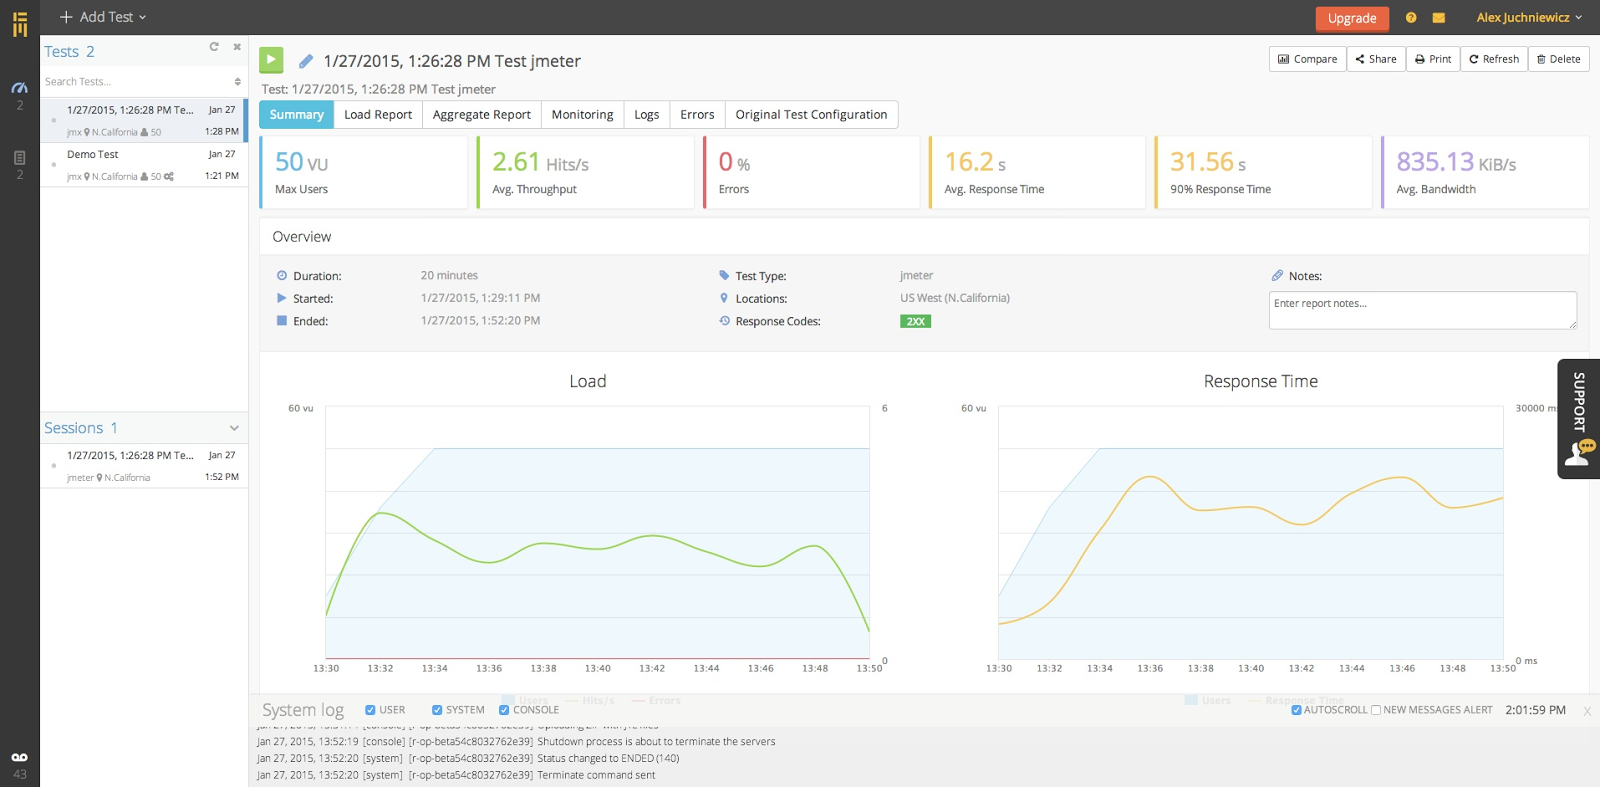
Now that you’ve run your load test, you can review the results on BlazeMeter and see a summary of users, throughput, errors, response times, and bandwidth. You can also access an aggregate report of load times on each page and a list of errors generated, demonstrated below.
The report is a high-level overview of site performance, but you’ll want more details for the full picture. New Relic- which you can enable through the Pantheon Site Dashboard- will provide more information on slow transactions and appserver response times for both web and non-web transactions.
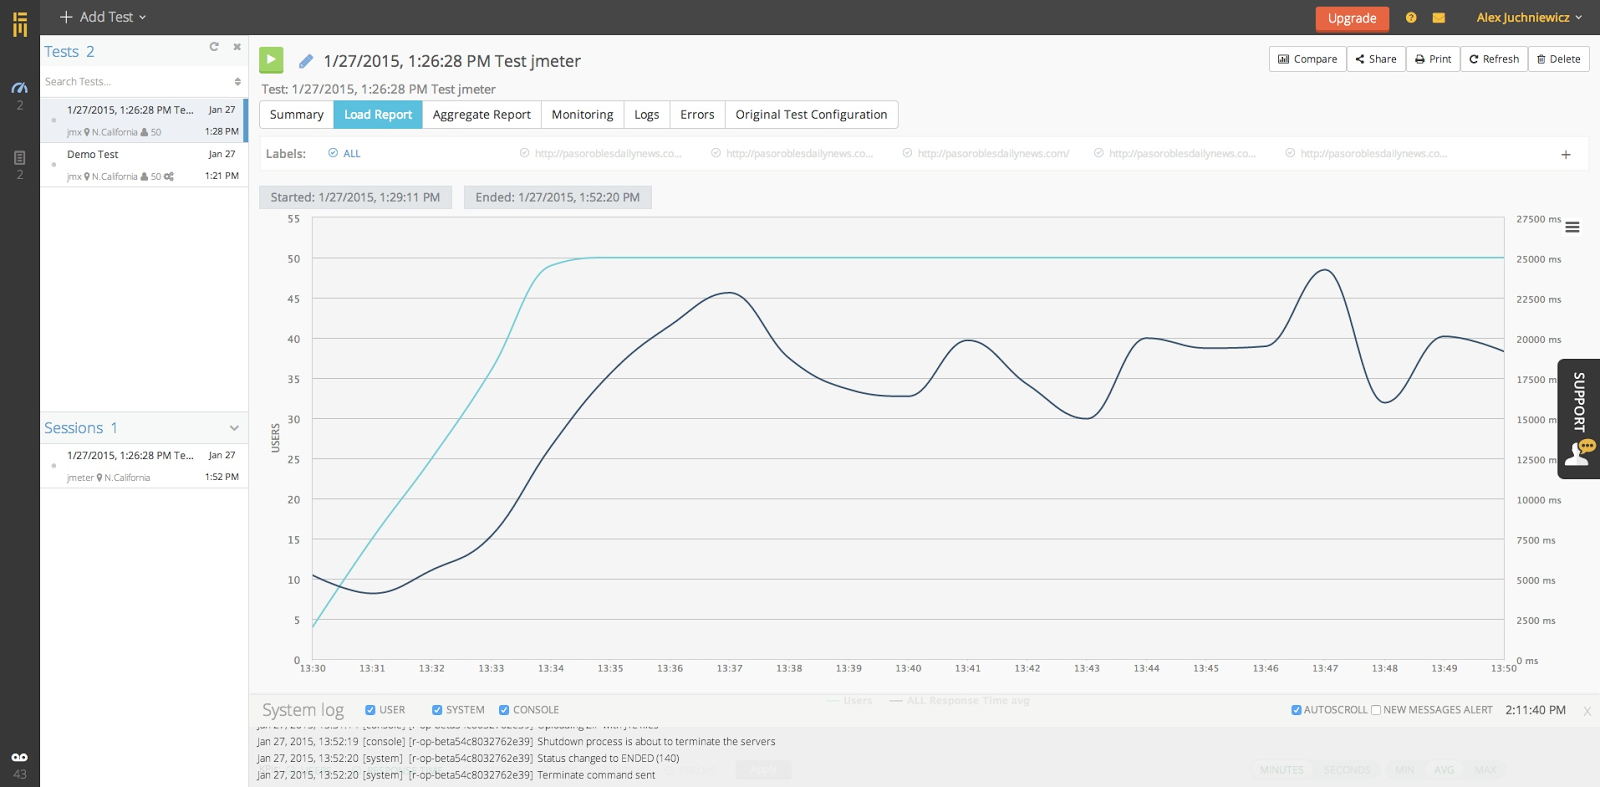
You can also view the load report directly to evaluate the number of users and the concurrent response time, shown here:
Depending on the application you’re running, you can also access error and slow logs for PHP and mySQL. Drupal can log these to the database with DBlog (though be sure to prune these regularly as they can bloat the database and slow your site down). WordPress has plugins like Debug Bar, SQL Monitor, P3, and Debug Queries.
Resolve Errors and Performance Hits
The errors and performance hits you discover will each will have a different solution. We recommend doing a search of the error message and reading solutions posted by others, or post your own issue and see if anyone else has an answer. Additionally, if a specific module or plugin is slow, check the issue queue to see if the problem is known and if a patch is available.
Outside of error messages, one the most common performance hit comes from slow queries. After the load test, check through the mySQL slow logs by downloading these logs via SFTP or, for a deeper dive try troubleshooting mySQL with New Relic Pro. If you have calls to external services, check through New Relic reports to see if these are slowing load times as well.


